Granting Azure AD Service Principal a Azure AD Directory Role

Occasionally customers utilize Azure AD service principals for automation of Azure AD management tasks. In this scenario, you must grant the service principal the necessary Azure AD directory role permissions to complete the task. This can be performed using AzureADPreview PowerShell module

# Connect with Azure AD Global Admin or user with permissions
Connect-AzureAD

# Find Azure AD role by built in name
$role = Get-AzureADMSRoleDefinition -Filter "DisplayName eq 'Security Administrator'"

# Find Azure AD service principal by display name
$sp = Get-AzureADServicePrincipal -Filter "DisplayName eq 'test123'"

# Assign Azure AD role to service principal
New-AzureADMSRoleAssignment -RoleDefinitionId $role.Id -PrincipalId $sp.ObjectId -ResourceScope "/"

NOTE: You can also now perform this directly from Azure AD Portal -> Roles and Administrators blade -> Role -> Add Assignments -> Select members -> Filter by service principal display name

What is Office 365 Shell WCSS-Client?

On a recent support case a customer noted that an application named “Office 365 Shell WCSS-Client” was found in his Office 365 and Azure AD sign in security logs.  This customer was concerned that this may be some type of malware.  After searching public documentation we could not find any information on what this application was, so we asked the product engineering teams to see if they could explain.  Our Office 365 UX team provided this very helpful description of what this application is and that it should not be viewed as malware:

Office 365 Shell WCSS-Client is the browser code that runs whenever a user navigates to (most) Office365 applications in the browser.  The shell, also known as the suite header, is shared code that loads as part of almost all Office365 workloads, including SharePoint, OneDrive, Outlook, Yammer, and many more.


The suite header needs authentication to do the following:


* Get information about the user’s licensing state, so that we know what apps to show in the app launcher


* Connect to services that provide information about most recently used documents, so that we can show those in the app launcher


* Connect to Exchange, so that we can provide mail and calendar notifications


* Authenticate against the Microsoft / O365 graph, so that we can get and set user preferences for things like language, user theme and other O365 settings

There are different providers for those different things, necessitating different auth exchanges.  These exchanges happen without direct user intervention, when a page hosting the shell code is loaded.  The shell code, workload-specific code (e.g. SharePoint) and the browser all cache different parts of this information in different ways, so that pattern might not always line up for each user in each workload, but multiple auth exchanges here are the norm. A typical user navigating through different Office365 workloads can expect to see several different requests such as shown in the logs”

O365 Product Engineer

Hopefully this helps someone understand what this application is in the future when performing a similar audit of their security logs in Office 365 or Azure AD.
Capturing a Fiddler trace

A Fiddler trace can be used to view any Http\Https web requests and responses made from your web browser. Capturing this data can be very useful for analyzing errors encountered. To capture a Fiddler trace, follow the steps below.

How to capture a Fiddler trace

  1. Download Fiddler from here and install it.
  2. Run Fiddler and go to Tools -> Fiddler Options.
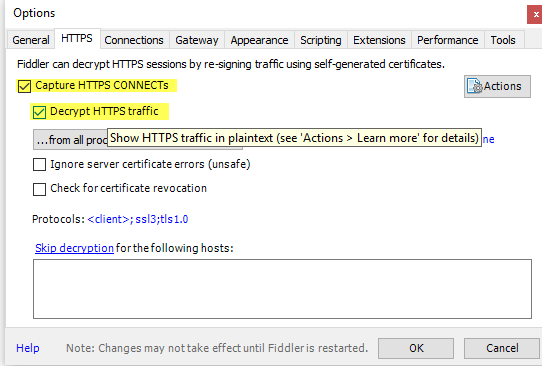
  3. On the HTTPS page, verify that Capture HTTPS Connects is enabled.
  4. Verify that Decrypt HTTPS traffic is enabled with the …from all processes option.
  1. NOTE: If you are in a Federated enviornment, please also check Rules -> Automatically Authenticate.
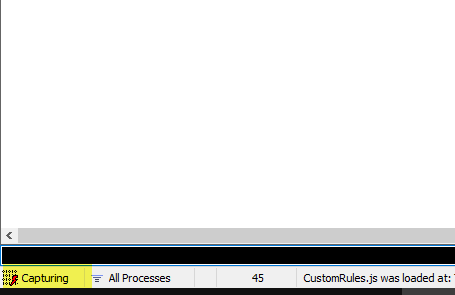
  2. In the very bottom left of the Fiddler application, ensure that you see “Capturing” displayed indicating that Fiddler is capturing traffic.
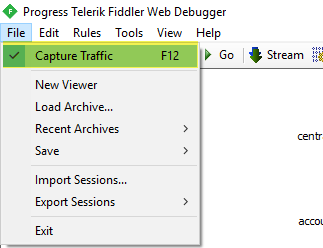
  1. If Fiddler is not capturing. Choose File -> Capture Traffic (Or press F12)
  1. Minimize Fiddler to tray.
  2. Replicate the reported issue.
  3. Once Complete, you can stop capturing by selecting File -> Capture Traffic again or pressing F12
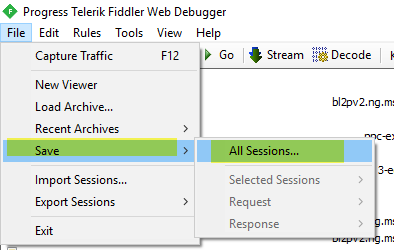
  4. In Fiddler, go to File -> Save -> All Sessions and save the archive to disk.
  1. Save .SAZ file locally and then provide this .SAZ to engineer troubleshooting your issue
  2. Once complete, Fiddler can be uninstalled from Windows Control Panel \ Programs and Features \ Uninstall “Progress Telerik Fiddler”

Capturing a HTTP Archive (HAR) trace

A HTTP Archive (HAR) trace can be used to view any Http\Https web requests and responses made from your web browser. HAR traces are useful when you do not want to install a full application like Fiddler, as HAR files can be captured naively using most Web Browsers like Edge, Chrome, or Internet Explorer. Capturing this data can be very useful for analyzing errors encountered. To capture a HAR trace, follow the steps below

To generate the HAR file for Internet Explorer
  1. Open Internet Explorer and go to the page where the issue is occurring.
  2. Press F12 on your keyboard(or click the gear icon > F12 Developer Tools)
  3. Click the Network tab.
  4. Reproduce the issue that you were experiencing before, while the network requests are being recorded.
  5. Once done click the Save button to export as HAR (or press Ctrl+S).
  1. Give the trace a filename and click the Save button which will save it as a .har file .
  2. Upload your HAR file to your ticket or attach it to your email so that we may analyze it.
To generate the HAR file for Chrome
  1. Open Google Chrome and go to the page where the issue is occurring.
  2. From the Chrome menu bar select View > Developer > Developer Tools .
  3. From the panel opened at the bottom of your screen, select the Network tab.
  4. Look for a round red Record button ( )) in the upper left corner of the Network tab, and make sure it is red. If it is grey, click it once to start recording.
  5. Check the box next to Preserve log .
  6. Click the Clear button ( )) to clear out any existing logs from the Network tab.
  7. Now try to reproduce the issue that you were experiencing before, while the network requests are being recorded.
  8. Once you have reproduced the issue, right click anywhere on the grid of network requests, select Save as HAR with Content , and save the file to your computer.
  1. Upload your HAR file to your ticket or attach it to your email so that we may analyze it.
To generate the HAR file for Edge
  1. Browse to the URL where you are seeing the issue.
  2. Navigate to Developer tools (use F12 as a shortcut) and select the “Network” tab.
  3. Refresh the page to start capturing the traffic between the browser to the server, or click on a link with which you are seeing the issue. The aim is to reproduce the issue and capture the output.
  4. Click on “Export as HAR” followed by Save As… to save the HAR file.
HAR trace Analysis with Fiddler

A support technician can then analyze this HAR trace using an application like Fiddler.

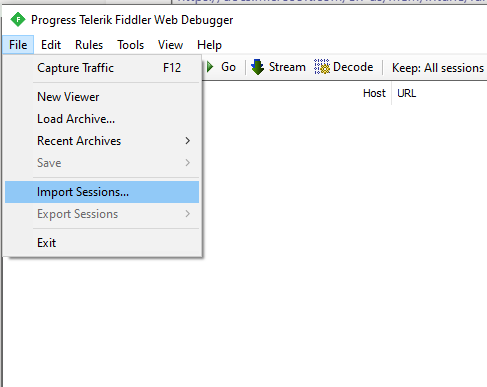
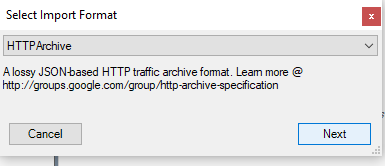
The steps for that are using the File -> Import Sessions option in Fiddler and then choosing HTTPArchive as shown below.